Let’s Start With a Story
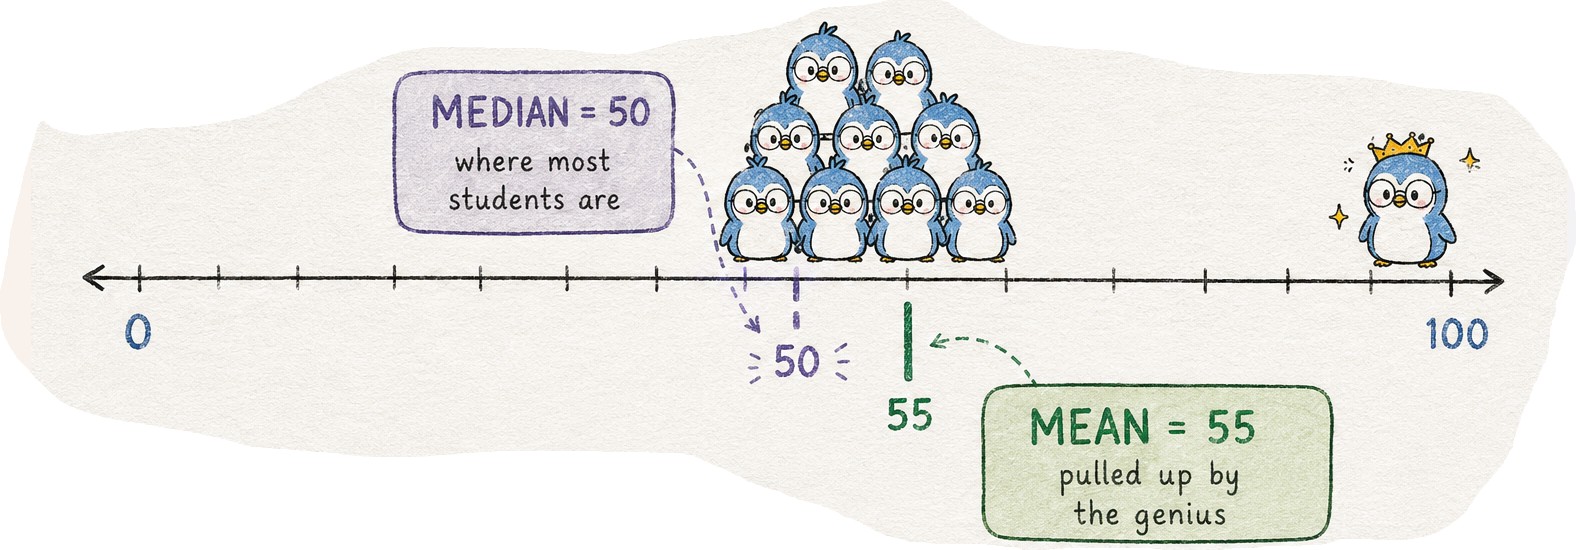
Imagine a class has 10 students. Nine students scored 50/100 on a test. But 1 student is a genius and scored 100/100.
🎯 Drag the outlier score and watch the magic happen!
Data: 50, 50, 50, 50, 50, 50, 50, 50, 50, 100
💙 Mean (Average)
55.0
changes with outlier
💜 Median (Middle)
50
stays the same!
But here’s the problem: almost everyone scored 50, not 55. The score of one exceptional student pulled the average higher than what most students actually achieved. So if you only looked at the average, you might get the wrong picture of the class.
Two Ways to Describe “Typical”
There are two simple ways to find a “typical” number in a group:
1. Mean (Average) Add up all the numbers, then divide by how many numbers there are. For our class, Mean = 55
2. Median (Middle Value) Line up all the numbers from smallest to biggest, and pick the one right in the middle. For our class, Median = 50
The median tells us that a typical student scored around 50, which matches what most students actually got.
Why Does This Happen?
The average gets “pulled” toward very high or very low numbers. One huge number (like 100) can drag the whole average up, even if everyone else scored much lower.
The middle value doesn’t care about how big or small the extreme numbers are - it just looks at where the “middle” of the group is.
Where You’ll See This in Real Life
- “Average salary at this company is $90,000” - but maybe the boss earns way more than everyone else, and most workers earn much less.
- “Average house price in this area is $1 million” - but a few giant mansions might be pulling that number way up.
- “Average screen time is 6 hours a day” - but maybe a few people use their phones 12+ hours, while most people use it for 2-3 hours.
The Big Takeaway
The mean (average) is useful, but it doesn’t always represent what’s typical.
When data contains extreme values, the median often gives a clearer picture of reality.
That’s why data analysts don’t stop at the average - they look deeper.
Another Real-Life Example
Still not convinced? Here’s the same idea with house prices:
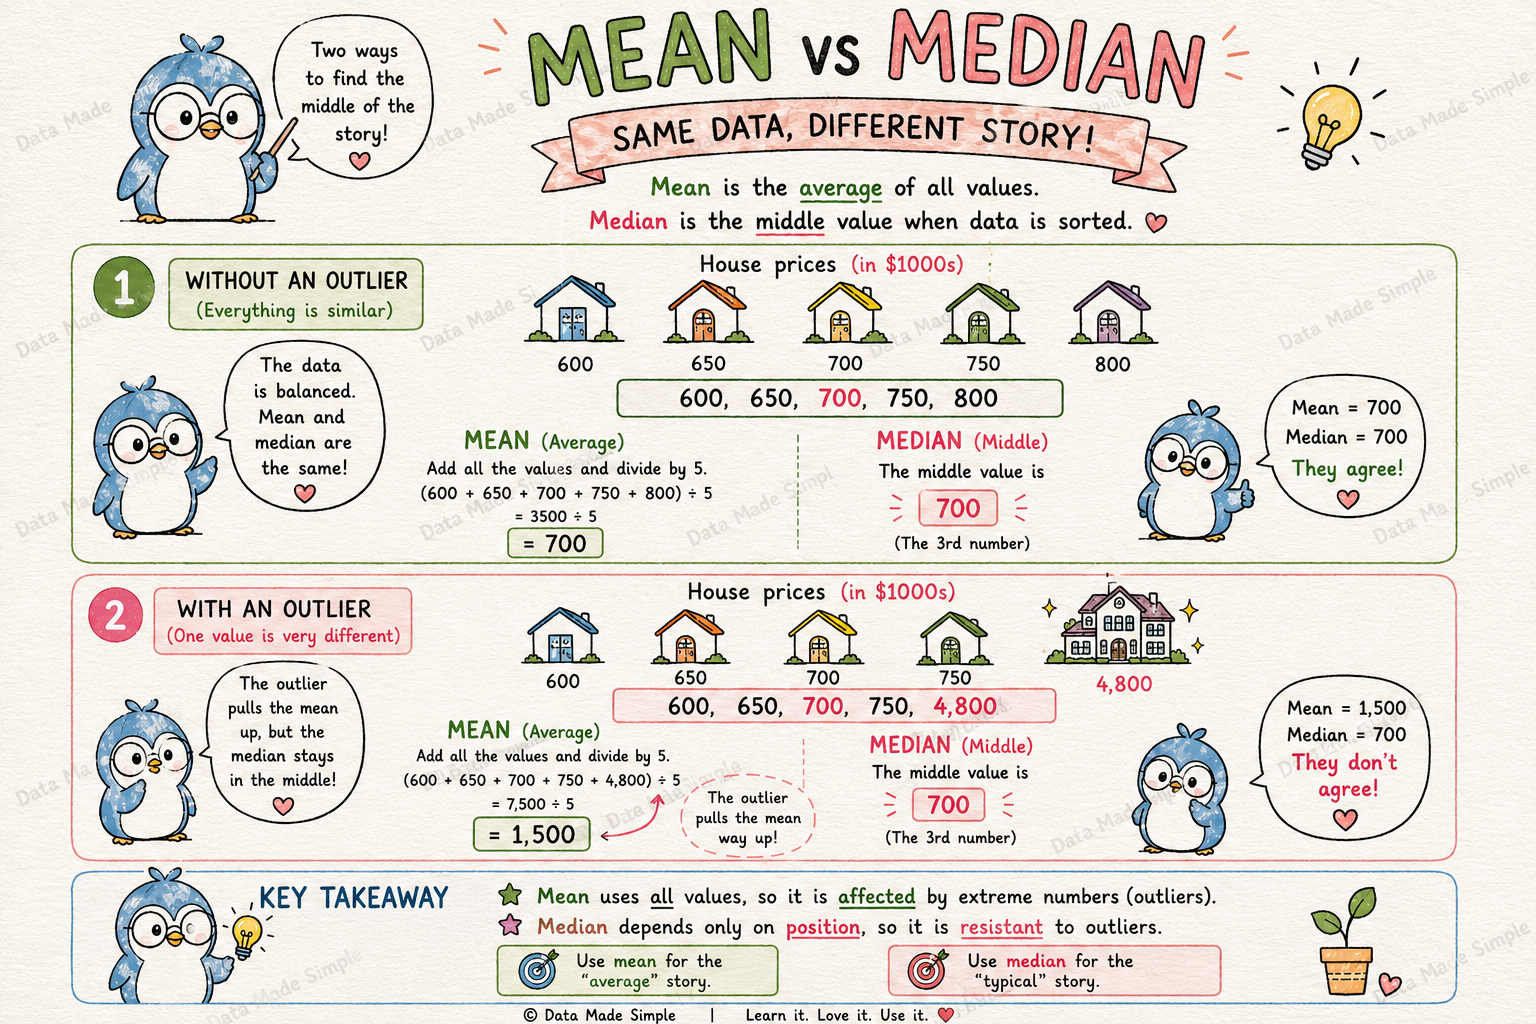
The story is the same - one extreme value (the mansion!) pulls the mean up, while the median stays where most houses actually are.
🧠 Quick Quiz — Test Yourself!
📸 Prefer learning visually? Follow @data.madesimple on Instagram - where we turn complex data concepts into cute, easy-to-understand visuals. 🐧📊