You and your friend both average 8,000 steps a day. Same average. Same fitness goal. But your weeks look completely different.
You walk about 7,800 to 8,200 steps every day. Some days are slightly higher, some slightly lower, but you are remarkably consistent.
Your friend is the opposite. One day she walks 2,000 steps. The next she finishes a half marathon and records 18,000. A few days later she barely leaves the couch with 1,500, then cycles to work and reaches 14,000.
The average only tells part of the story. The missing piece - the difference between consistent and unpredictable - is exactly what standard deviation measures.
What “spread” means
Before we define standard deviation, think about something simpler. Imagine someone tells you the average quiz score in your class was 70%. Do you actually know how the class performed?
Maybe almost everyone scored between 68% and 72%. Or maybe half the class scored 40% while the other half scored 100%, and the average happened to land at 70%. Those situations feel completely different, even though the average is exactly the same.
The average tells you the centre of the data. It does not tell you how spread out the values are. That is where standard deviation comes in. It gives that spread a number.
What standard deviation actually is
Standard deviation is a single number that tells you how far the typical value is from the mean (average).
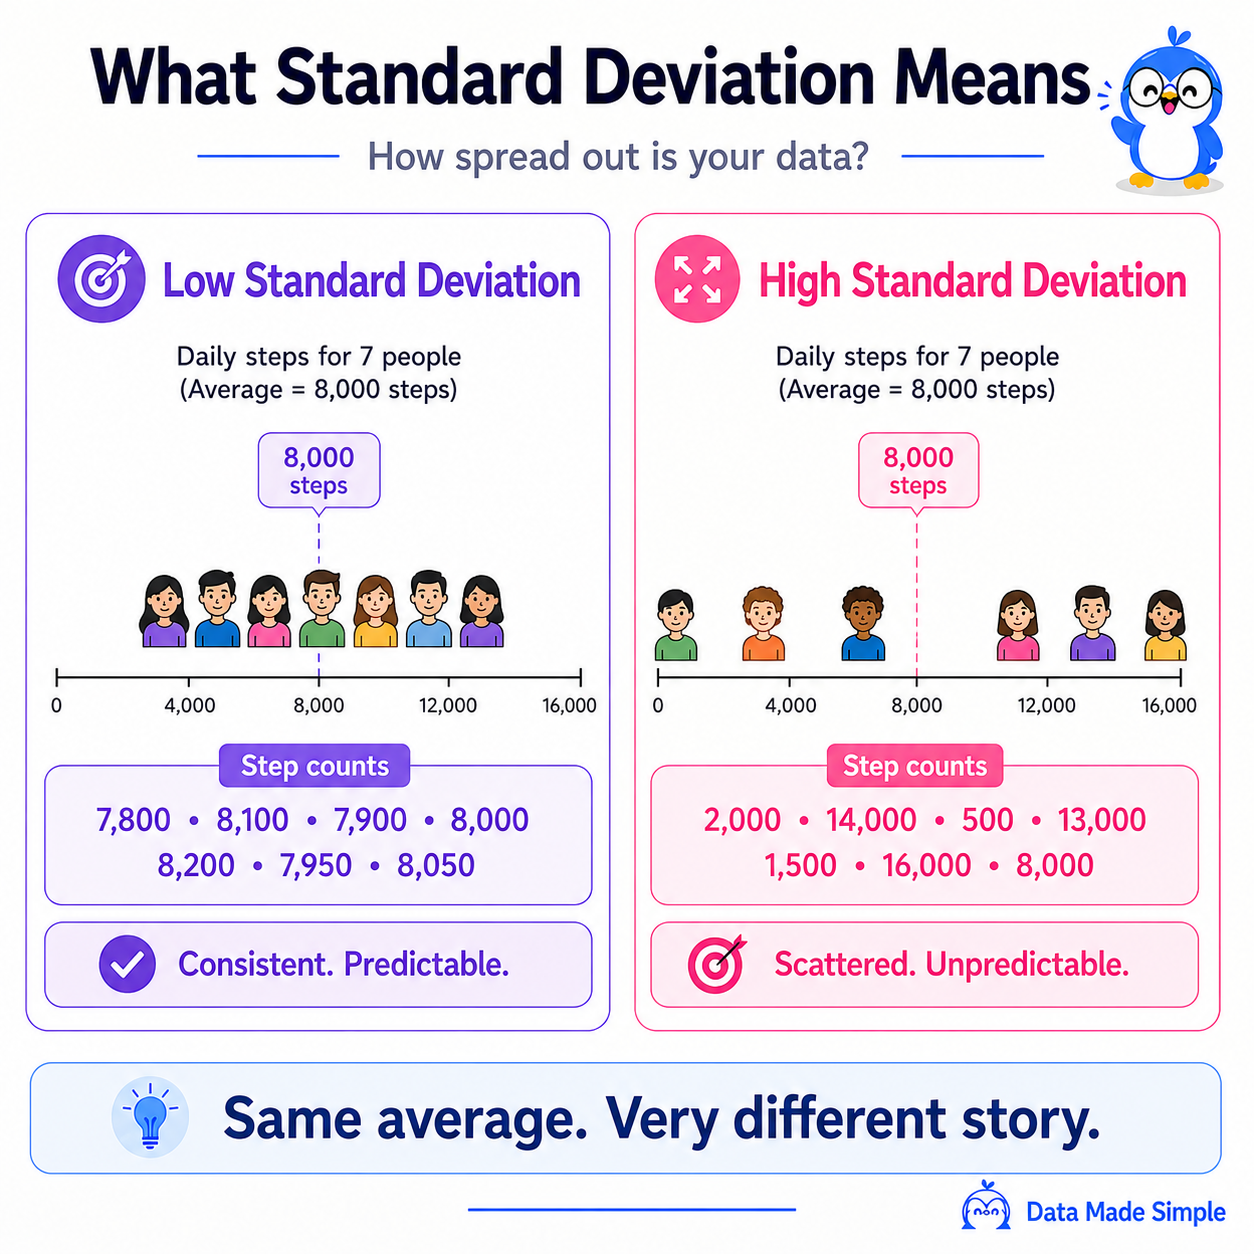
- A low standard deviation means most values are close to the average. The data is consistent and predictable.
- A high standard deviation means values are spread much farther from the average. The data is more variable and less predictable.
That is genuinely all it is. The formula and calculations are simply a way of measuring that idea precisely.
Back to the steps example
Here are the same two people over one week.
| Day | Your steps | Friend’s steps |
|---|---|---|
| Monday | 7,500 | 2,000 |
| Tuesday | 8,200 | 18,000 |
| Wednesday | 8,000 | 1,500 |
| Thursday | 7,800 | 14,000 |
| Friday | 8,100 | 500 |
| Saturday | 7,900 | 16,000 |
| Sunday | 8,000 | 8,000 |
Your numbers stay close together. Your friend’s jump all over the place. The average cannot tell those stories apart. Standard deviation can.
If a fitness app wanted to predict how many steps you would take tomorrow, your low standard deviation would make that prediction relatively easy. For your friend, tomorrow could look almost anything like last week - a prediction would be much less reliable.
The formula, made simple
By now, you already know what standard deviation does: it measures how spread out your data is. The formula simply describes how we calculate that spread.
The calculation in plain English
- Find the mean (average) of your data.
- For each value, subtract the mean and square the result.
- Add all the squared differences together and divide by n. This gives you the variance.
- Take the square root of the variance. That is your standard deviation.
Now that you know the steps, here is the mathematical shortcut you will often see in textbooks:
$$\sigma = \sqrt{\frac{1}{n}\sum_{i=1}^{n}(x_i-\mu)^2}$$
Don’t worry if it looks intimidating. It is simply a compact way of writing the four steps above.
What each symbol means
| Symbol | What it means |
|---|---|
| σ (sigma) | The standard deviation - the answer we are looking for. |
| μ (mu) | The mean (average) of the data. |
| xᵢ | One value from the dataset. |
| n | The total number of values. |
| Σ (capital sigma) | Add all of these values together. |
Why all the extra steps?
- Squaring makes every difference positive, so values above and below the mean don’t cancel each other out.
- Taking the square root changes the answer back into the original units. If your data is measured in steps, your standard deviation is also measured in steps.
You don’t need to memorise this formula. The important idea is that standard deviation measures how spread out your data is. Understanding that concept is far more valuable than remembering the equation.
See it yourself
The slider below shows a group of people tracking their daily steps. Drag it to change how spread out the data is and watch the standard deviation update in real time.
Where standard deviation shows up in real life
Standard deviation is not just something you learn in statistics class. It is used anywhere people want to understand how consistent or unpredictable data is.
🏃 Health and fitness
A runner who covers about the same distance every week has a low standard deviation. A runner whose weekly distance changes dramatically has a high standard deviation. Coaches use this to spot burnout, injury risk, or gaps in training.
📚 School results
Two classes can have the same average test score but very different standard deviations.
- A low standard deviation means most students performed similarly.
- A high standard deviation means some students did very well while others struggled.
This helps teachers understand how evenly the class has learned the material.
📈 Finance
Investors often use standard deviation as a measure of risk.
- A low standard deviation suggests prices tend to stay relatively stable.
- A high standard deviation means prices move up and down more dramatically.
Higher variability can mean bigger potential gains, but also bigger potential losses.
🏭 Manufacturing
A factory making bolts wants every bolt to be nearly the same size.
- A low standard deviation means production is consistent.
- A high standard deviation means the sizes vary too much.
Quality control teams monitor standard deviation to catch problems before they become expensive.
Quick check
Remember before the quiz
Low SD - values are close to the mean. Consistent.
High SD - values are spread out. Variable.
Standard deviation is one of those ideas that sounds complicated until you realise it is just measuring something you already understand intuitively. Spread. Consistency. How much things vary day to day.
Next time you see an average, ask the follow-up question: how spread out is the data behind it? That question is what separates a beginner from someone who actually knows how to read data.
Want to see this idea as a quick visual? Follow @data.madesimple on Instagram for bite-sized explainers on statistics, data science, and more. 🐧