Linear function and linear regression sound alike but they do completely different jobs. One follows a rule. The other discovers one. And once you see the difference, a lot of data science starts to make sense.
A Tale of Two Lines
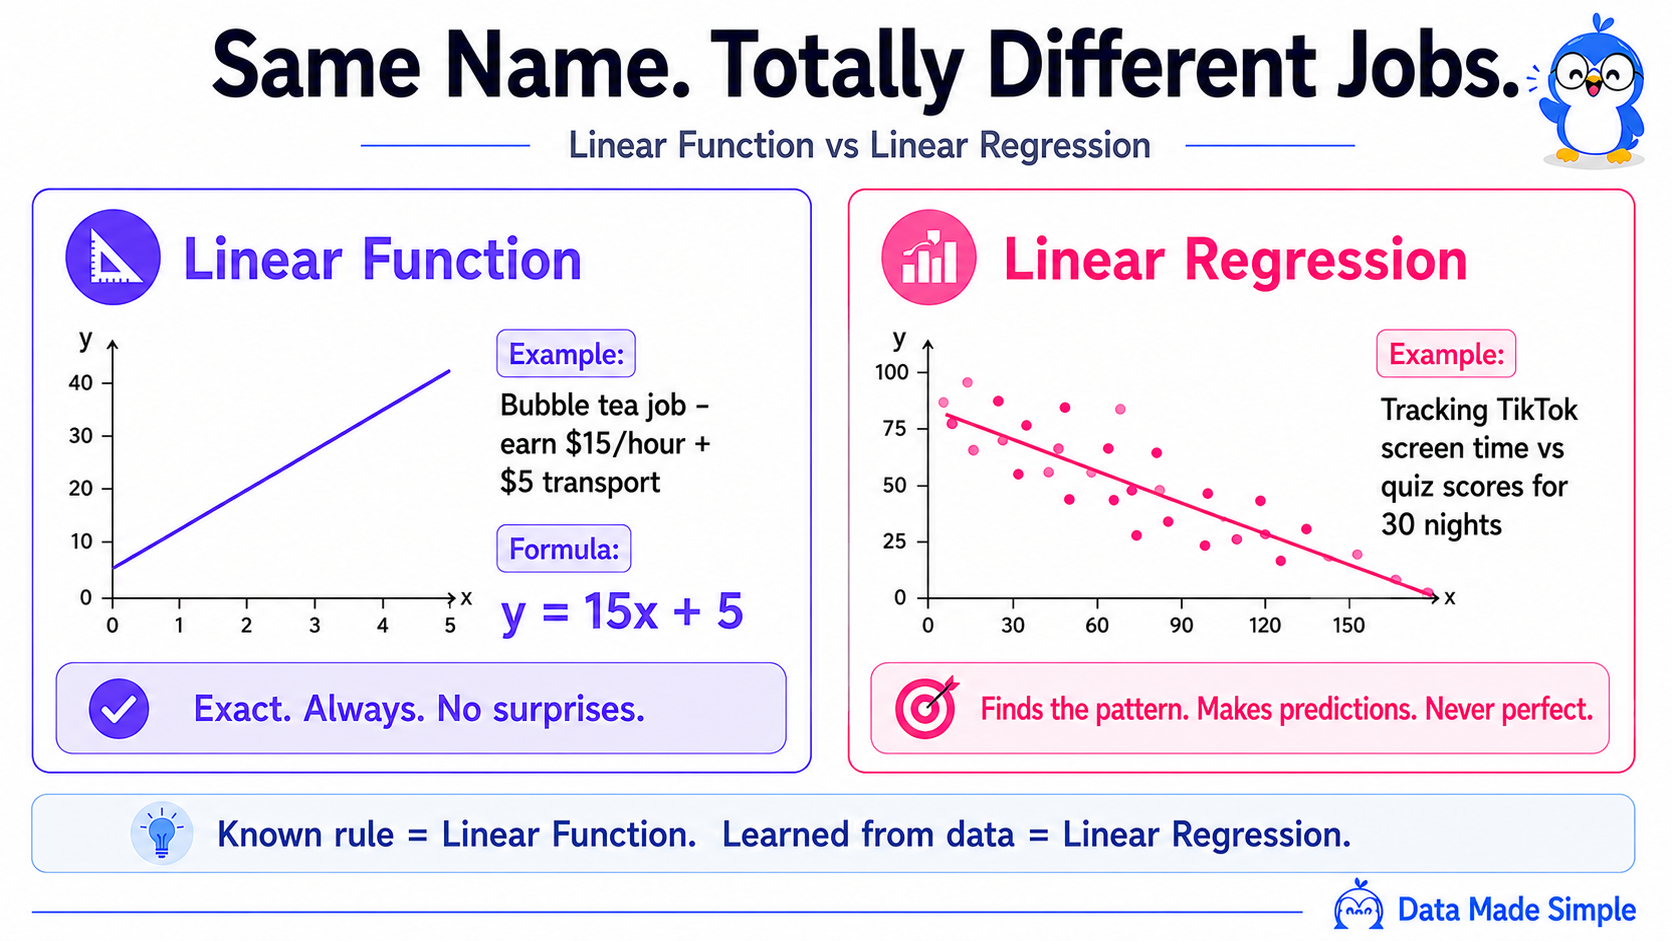
You and your friend both work part-time at a bubble tea shop. You get paid $15 per hour. Simple. After 3 hours you know you’ve earned $45. After 6 hours, $90. There’s a perfect formula. No surprises, no guessing.
Your friend is working on something different. She’s noticed that the more hours she spends on TikTok before bed, the worse she does on next-day quizzes. She doesn’t have a formula for this. So she tracks her own data for a month, screen time each night and quiz score the next morning, and looks for the pattern.
Both of you are thinking about a straight line. But you’re using it in completely different ways.
That’s the difference between a linear function and linear regression.
Now let’s watch linear regression in action!
The chart below shows the price of bubble tea at the same shop over 30 months. Nobody wrote a formula for how the prices should change. Instead, they changed naturally over time because of factors like inflation, rising ingredient costs, higher wages, and changes in demand.
The computer doesn’t know why the prices changed. It only sees the numbers and looks for a pattern. Press Play to watch it discover the line that best explains the overall trend and use it to predict the price for Month 31.
What is a Linear Function?
A linear function is a rule. You put a number in, you get a number out. Every single time, with no surprises. If you want a deeper dive, check out our full post on linear functions.
The formula looks like this:
y = mx + b
Where:
- x is the input (like hours worked)
- y is the output (like your pay)
- m is the slope. How much y changes when x goes up by 1
- b is the starting point. What y is when x = 0
Your bubble tea job: You earn $15 per hour, plus a $5 transport allowance every shift.
y = 15x + 5
Work 4 hours: y = 15(4) + 5 = $65. Exactly.
No guessing. No uncertainty. The formula is known before you even start.
Why We Even Need Regression
Most interesting questions in real life don’t come with a formula. Nobody can hand you an equation for predicting your exam score, your Spotify usage, or whether you’ll get into uni. What you do have is data. Lots of it.
Imagine you tracked your TikTok screen time every night for 30 days and recorded your quiz score the next morning. What do you think the data would look like? A perfect straight line? Or completely random?
Most likely it’s somewhere in between. A messy cloud of dots with a pattern hiding inside it. That’s exactly where linear regression comes in.
Linear regression draws one line through messy data. It won’t hit every point. It isn’t supposed to. It simply finds the line that is closest to all of them overall. Once you have that line, you can make predictions.
Your friend’s TikTok data: After 30 nights of tracking, she notices the trend. More scrolling, lower scores. But it’s not perfectly consistent. Some nights she scrolled 2 hours and still did okay. Other nights even 30 minutes seemed to wreck her concentration.
Linear regression finds the best-fit line through all 30 messy data points. Now she can predict: “If I scroll for 90 minutes tonight, I’ll probably score around 58% tomorrow.”. The key word is probably. Not exactly. That’s the big difference.
Side by Side: The Key Differences
| 📐 Linear Function | 📊 Linear Regression | |
|---|---|---|
| Where does the formula come from? | Already known | Discovered from data |
| Is the result exact? | Yes, always | No, it’s an estimate |
| What does it deal with? | Perfect relationships | Messy, real-world data |
| What’s it used for? | Calculating known rules | Making predictions from patterns |
| Example | Bubble tea pay calculator | Predicting quiz score from screen time |
The one-line version: linear function = you know the rule. Linear regression = you find the rule from data.
A Real Example: Does Sleep Actually Affect Your Grades?
A first-year uni student is convinced that all-nighters are fine. His friends disagree. So they do what any data nerd would do: collect evidence.
They survey 8 students: hours of sleep the night before an exam, and the score they got.
| Hours of Sleep | Exam Score |
|---|---|
| 4 | 48 |
| 5 | 55 |
| 5 | 61 |
| 6 | 63 |
| 6 | 70 |
| 7 | 72 |
| 8 | 78 |
| 9 | 80 |
You can see the trend. More sleep, better score. But it’s not perfectly smooth. The two students who both slept 5 hours got different scores. That’s real life.
Linear regression draws the best possible line through these points. The result looks something like:
Predicted Score = 7 x (Hours of Sleep) + 18
So for someone who slept 7.5 hours:
Predicted Score = 7 x 7.5 + 18 = 70.5
Not guaranteed. But a much better guess than nothing. And yes, the data does make a pretty convincing case against all-nighters.
Why Isn’t the Line Perfect?
Here’s something that trips a lot of beginners up: in linear regression, predictions are never perfect. And that’s completely fine! Every prediction has a small gap between what the model guessed and what actually happened. This gap is called the residual (or just the error). Linear regression doesn’t ignore these gaps. It actually works by minimising them. It finds the line that keeps the total error as small as possible across all your data points.
Here’s the surprising part: the line doesn’t already exist somewhere waiting to be found. The computer invents it from the data. Every time.
This is completely different from a linear function, where there is no error at all. The formula is exact because someone already worked it out for you.
So next time you’re wondering which one to use, ask yourself one question: did someone give me the formula, or do I need to find it myself from data?
The Connection to Machine Learning
Here’s something cool. The first machine learning model many students ever build is just linear regression.
Before neural networks. Before deep learning. Before any of the complex stuff you might have heard about. Everything starts with learning how to fit a line to data.
If you read the Data Pipeline post, you saw that the Model step is where patterns get learned. Linear regression is almost always the first model a data scientist tries. It’s simple, fast, and surprisingly powerful.
Once you’re comfortable with it, the next ideas follow naturally:
- Multiple linear regression: what if more than one thing affects the outcome? (Sleep hours and screen time and how many coffees you had?)
- Logistic regression: what if you’re predicting yes or no instead of a number? (Pass or fail, not just a score)
- Overfitting: what if your model fits your 8-student dataset perfectly but completely fails on new students?
Quick Check
🧠 Remember this before the quiz
Someone gives you the formula → Linear Function
Someone gives you the data → Linear Regression
Known rule = Function. Learned rule = Regression.
Congratulations! You now understand something that confuses a surprising number of people. From now on, whenever you see a line on a graph, you’ll know to ask: “Is this a rule… or is it a pattern learned from data?”. That’s exactly how data scientists start thinking.
Want to remember this in 30 seconds instead of rereading the whole article? Follow @data.madesimple on Instagram for bite-sized visual explainers, simple diagrams that make math, statistics, machine learning, and data science easier to understand and remember.