Imagine You’re a School Principal
It’s the end of the year. Hundreds of students have taken exams. Some did incredibly well. Others struggled. Parents want answers. Teachers want answers. And you have one important question:
“What actually helps students achieve better results?”
The answer is hidden somewhere inside the data. But there’s a problem - the data is a mess. Missing scores, duplicate records, obvious mistakes. Right now, all you have is a giant spreadsheet that looks more confusing than helpful.
So how do data scientists turn that chaos into useful answers? They follow a process called the Data Pipeline. Let’s follow the journey together.
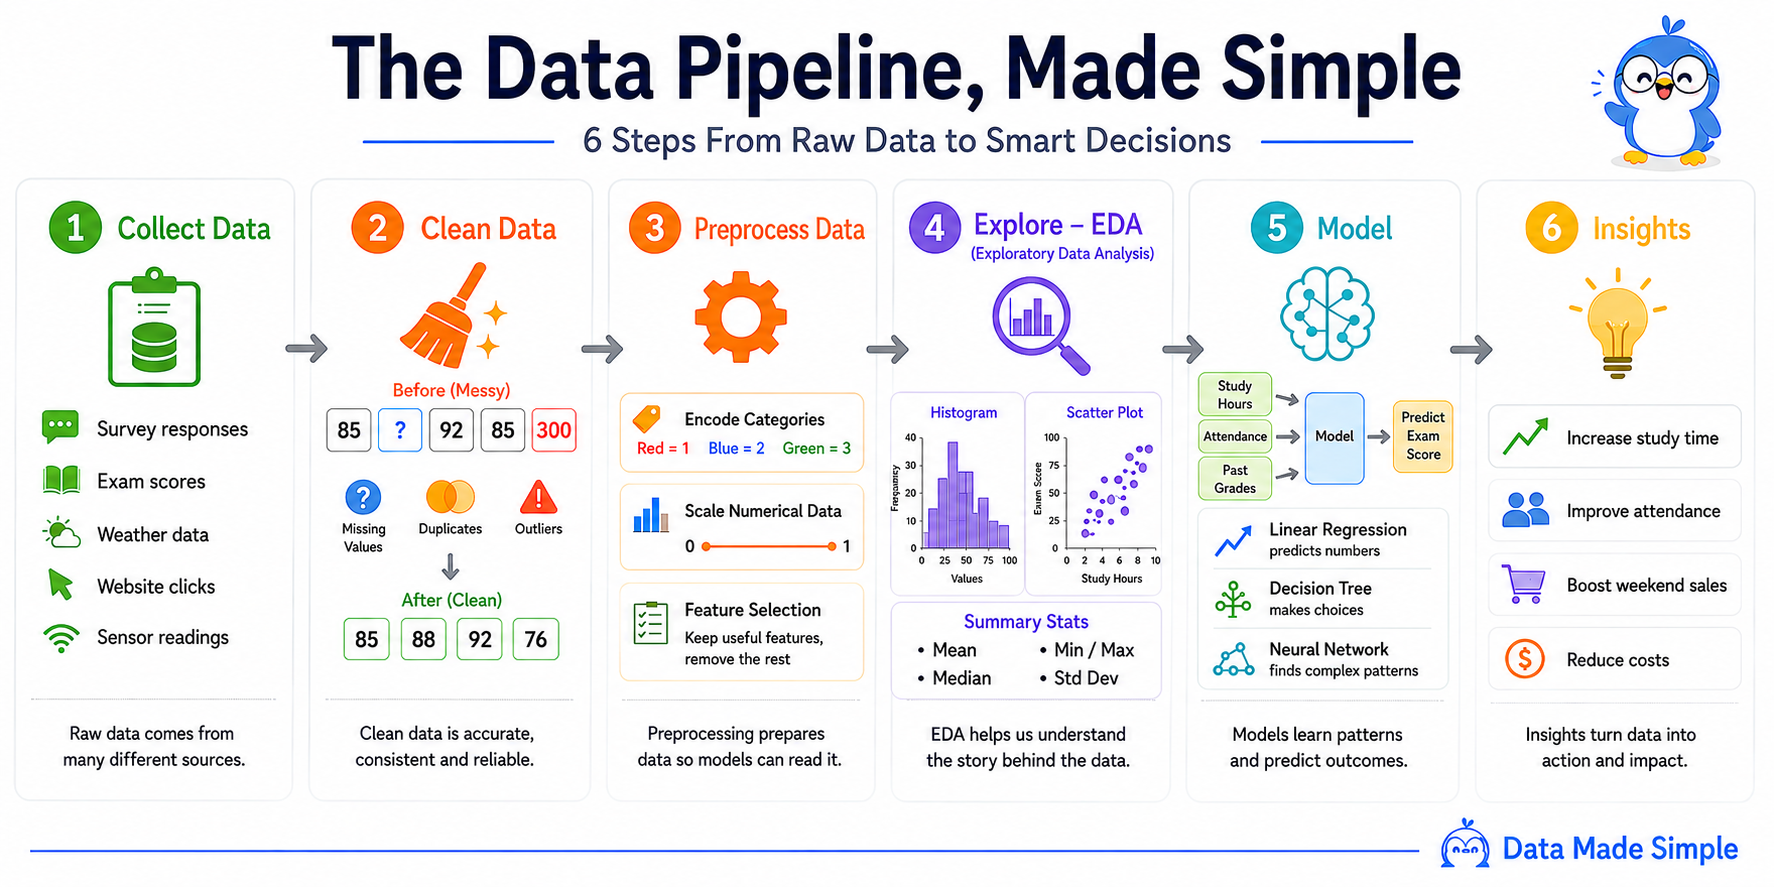
Step 1: Collect Data
Before we can answer any question, we need information - exam scores, attendance records, study hours, survey responses, maybe even activity from the school’s learning platform. At this stage we’re not looking for answers yet. Think of yourself as a detective collecting evidence before solving a mystery.
Raw data comes from many different sources.
Step 2: Clean Data
Now we open the spreadsheet. Immediately, problems jump out. One student has no exam score. Another appears twice. One record says a student scored 300% - unless someone discovered a way to exceed perfection, something is clearly wrong.
This is why cleaning matters. Before: 85, ?, 92, 85, 300. After: 85, 88, 92, 76. Cleaning data isn’t glamorous, but it’s one of the most important jobs in data science. Even the smartest analysis cannot fix bad data.
Clean data is accurate, consistent and reliable.
Try It - Clean This Dataset!
Daily weather readings - Auckland, June 2026. This dataset has 4 problems. Can you find and fix them all?
| Date | Temp (°C) | Humidity (%) | Rainfall (mm) | Wind (km/h) |
|---|
Step 3: Preprocess Data
Here’s where beginners often get confused: if we just cleaned the data, why do we need another step? The answer is that cleaning and preprocessing solve different problems. Cleaning fixes errors - removing duplicates, filling missing values, correcting mistakes. Preprocessing transforms the data into a format that machine learning models can actually work with. Think of it this way: cleaning makes the data correct, preprocessing makes it usable.
So we translate. “Red” becomes 1, “Blue” becomes 2, “Green” becomes 3. Large numerical ranges get scaled down (an age range of 18-80 becomes a neat 0-1 scale). Columns that don’t help answer our question get removed entirely. The data hasn’t changed its meaning - we’ve simply made it easier for a computer to read.
Preprocessing prepares data so models can read it.
Step 4: Explore the Data (EDA)
This is the step many beginners rush past - and it’s often the most valuable. The reason people skip it is simple: it feels unproductive. No model is being built, no predictions are being made. But before writing a single line of model code, the best data scientists pause and ask: “What is the data already trying to tell us?”
We create charts, calculate averages, and look for patterns. Maybe students who attend class regularly score higher. Maybe something completely unexpected appears. This process is called Exploratory Data Analysis (EDA) - where curiosity meets data. Sometimes the most important discoveries happen here, before any model is involved.
EDA helps us understand the story behind the data.
Step 5: Build a Model
Now we’re ready to make predictions. We feed the model historical examples - different students with their study hours, attendance records, previous grades, and actual exam scores - and let it learn the relationships between all of these factors simultaneously. Over enough examples, it starts to recognize patterns that are invisible to the human eye.
Different models learn in different ways. A Linear Regression model predicts numbers directly. A Decision Tree follows a series of yes/no rules. A Neural Network can discover far more complex relationships in the data. The goal is always the same: learn from the past to make better predictions about the future.
Models learn patterns and predict outcomes.
Step 6: Generate Insights
Remember our school principal? Now we can finally help. The analysis reveals that students who study more than three hours tend to score significantly higher, that attendance strongly predicts performance, and that certain classes consistently outperform others.
These aren’t just numbers anymore - they’re insights. And insights lead to action: more support for struggling students, better attendance programs, smarter resource allocation. This is the moment data becomes genuinely useful.
Insights turn data into action and impact.
The Big Picture
At first, data science can seem complicated. But underneath the code, the charts, and the algorithms is a surprisingly simple idea: ask a question, collect data, prepare it, understand it, learn from it, act on it. That’s the Data Pipeline - and every data project, whether it’s predicting exam scores, forecasting sales, or training AI, follows the same journey.
From messy data to better decisions.
Your Turn
The next time you see a chart, hear a statistic, or read a headline based on data, try asking yourself: “Which step of the pipeline produced this?” You’ll start seeing data science everywhere.
Quick Quiz - Test Yourself!
Test Your Pipeline Knowledge!
Keep Learning With Data Made Simple
If this post helped make data science feel a little less intimidating, you’re exactly why Data Made Simple exists. We’re building a collection of beginner-friendly guides, interactive activities, and visual explanations designed for curious learners, students, and anyone who has ever thought “I have no idea what any of this means.”
Follow Data Made Simple on Instagram for bite-sized explanations, visual guides, quizzes, and new content every week: @data.madesimple
Because data doesn’t have to be complicated.